Real-Time Compliance Dashboards for Executive Decisions

Michael Iyiola
Co-Founder, CWORT
See how real-time compliance dashboards for executives turn trusted data into clear risk signals, accountable actions and stronger regulatory oversight.

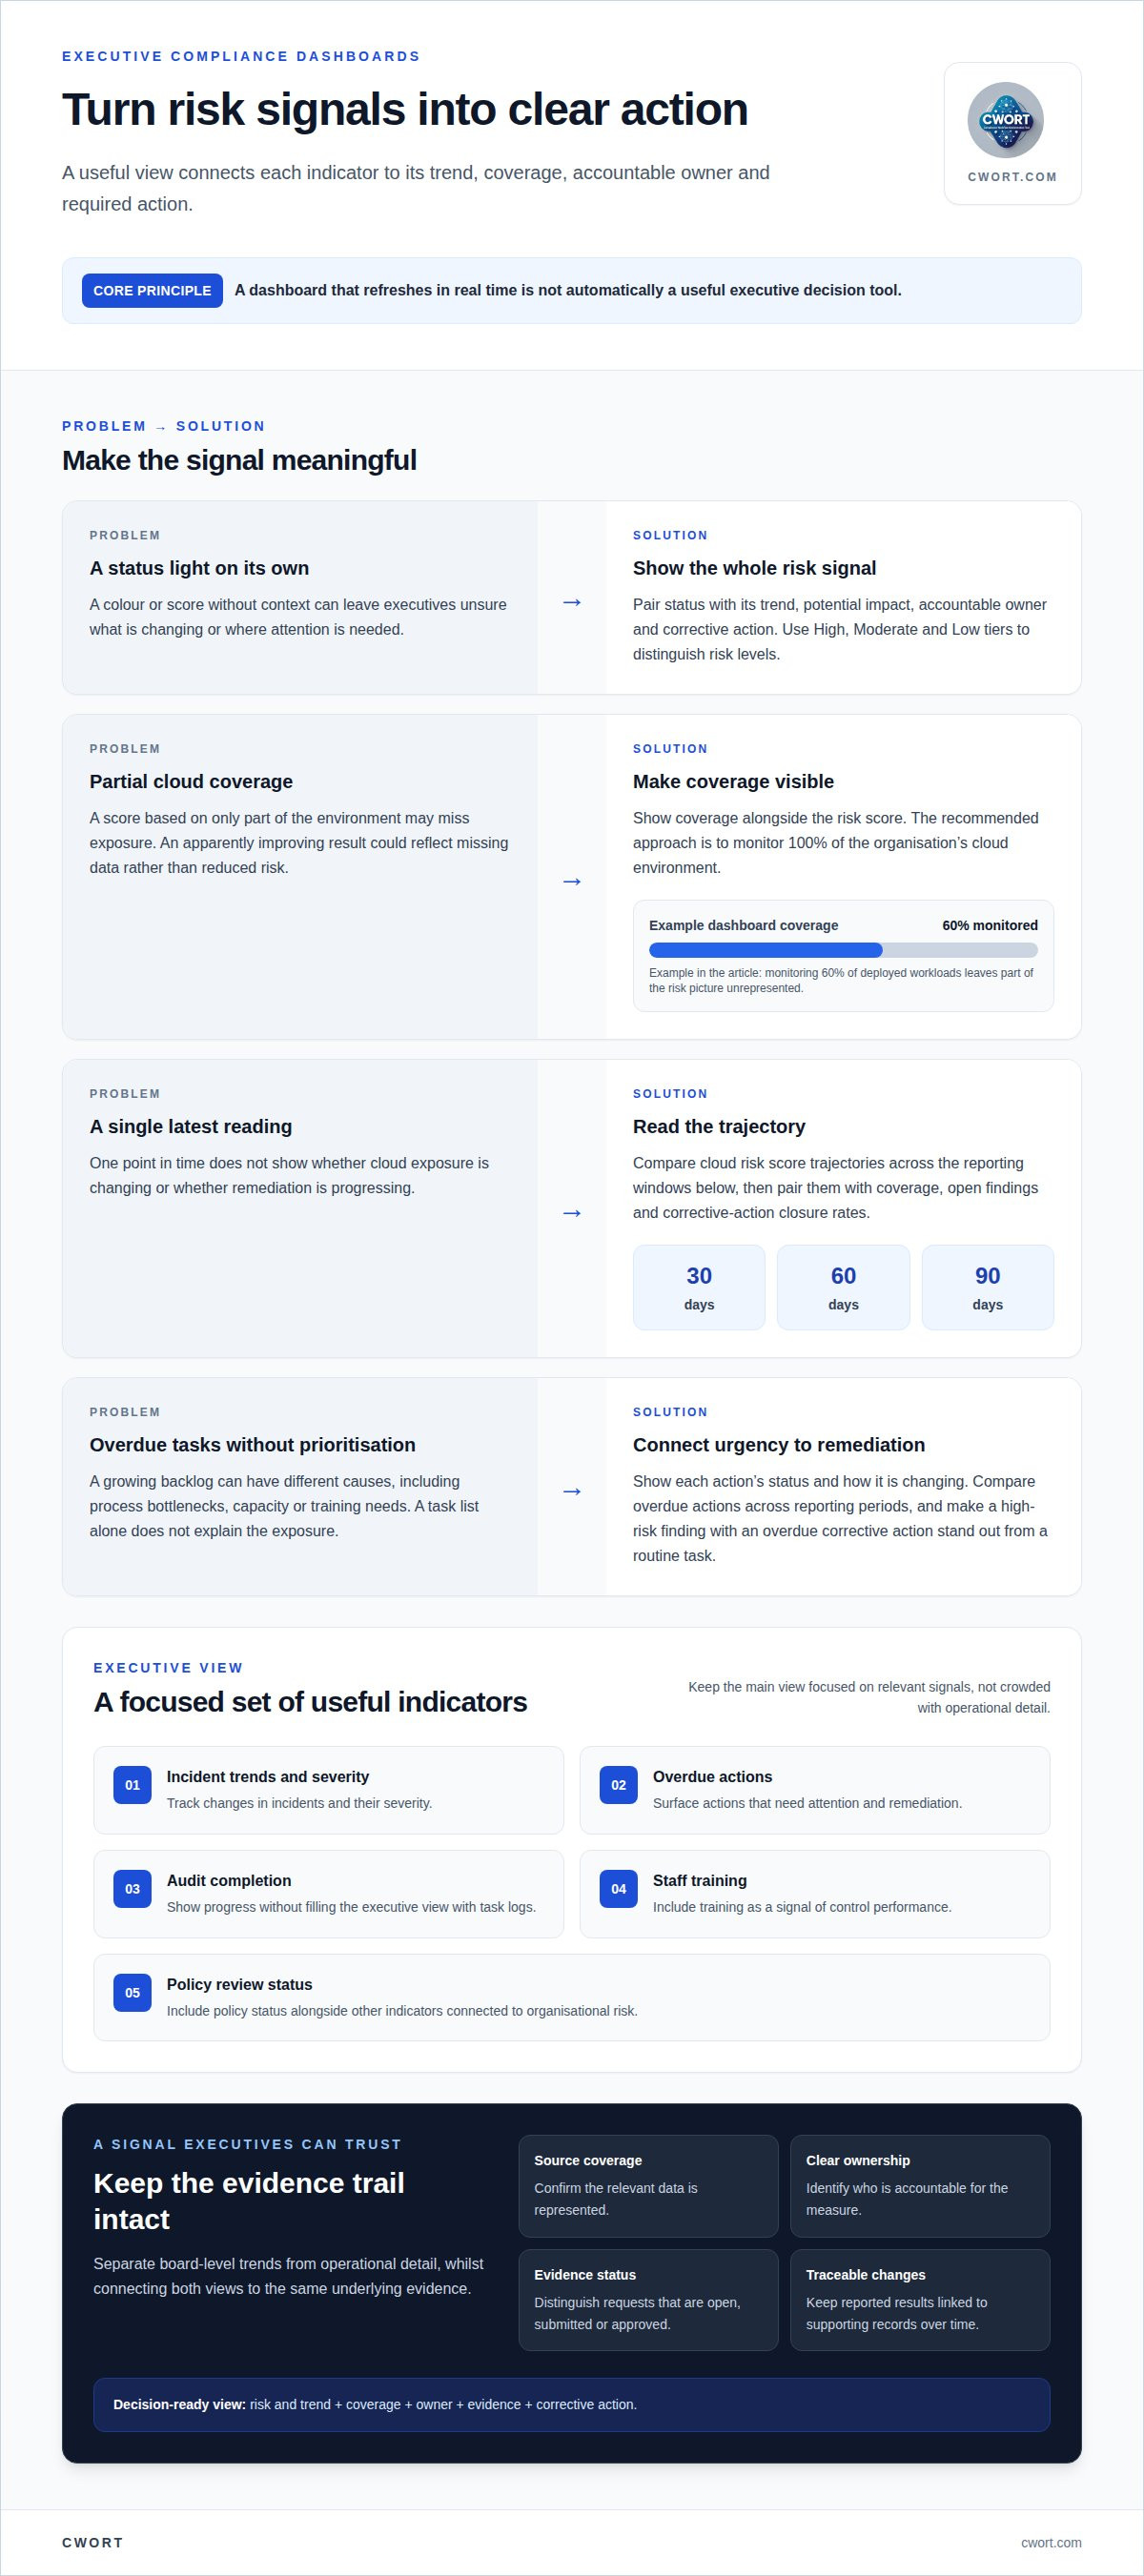
A dashboard that refreshes in real time is not automatically a useful executive decision tool. Real-time compliance dashboards for executives bring key indicators, risks and actions into a clear view, helping leaders see where attention is needed and what is changing. Their value depends on relevant measures, reliable data and a clear connection between evidence and decisions.
That distinction matters when regulatory information is spread across teams and systems. A centralised view can make trends easier to interpret, but it must show more than status lights: executives need context, ownership and a clear path from identified issues to corrective action.
This article explains what executive compliance dashboards show, how centralised data supports timely reporting, and how to design useful security, risk and compliance views. It also covers how to select meaningful indicators, set role-appropriate levels of detail and present evidence to support sound oversight.
Key Takeaways
- Focus executive reporting on a small set of relevant indicators that reveal changing risks, overdue actions and areas needing attention.
- Separate board-level trends from operational detail so each audience can act on information suited to its responsibilities.
- Centralise compliance data and establish clear ownership to improve consistency, traceability and confidence in the evidence behind reports.
- Design dashboard views to connect each risk signal with its context, accountable owner and corrective action.
- Use CWORT’s compliance readiness, assessment and management offerings when structured execution and auditable compliance evidence are needed for DORA, UK NIS, NIS2 or ISO 27001.
Table of Contents
- Real-time security, risk and compliance dashboards
- Security reporting for CISOs and boards
- What Are Compliance Dashboards?
- Centralised compliance data and dashboard infrastructure
- Executive compliance dashboard design
- CWORT
Real-time security, risk and compliance dashboards
Executive dashboards turn current security and compliance information into a view of organisational risk. Their value comes from connecting each indicator to its trend, owner and required action.
Compare dashboard platforms using consistent criteria: data coverage, update frequency, evidence traceability, access controls and reporting detail. Security features should include role-appropriate access and clear change records. When comparing costs, distinguish included features from service scope.
In the UK, dashboard-tool costs depend on the case and are given after a quote request; factors include user numbers, integrations, data coverage and required features. Compare these against the effort saved on manual reporting, rather than treating the headline price as the only measure.
Risk and overdue-task visibility
Risk and overdue-task visibility should show executives which exposures and actions need attention, their status and how they are changing. A growing backlog in one business unit can prompt investigation into causes such as process bottlenecks, capacity or training needs. Reviewing overdue actions across reporting periods helps leaders distinguish persistent issues from isolated delays and direct remediation accordingly.
Use risk scoring or heat maps to distinguish issues with the greatest potential impact. High, Moderate and Low tiers, supported by colour codes or trend arrows, help leaders spot warning signs while retaining access to detail. For example, an overdue corrective action linked to a high-risk finding should stand out more than a routine task awaiting completion.
For cloud risk, show coverage as well as the score. A dashboard monitoring only 60% of deployed workloads leaves part of the risk picture unrepresented; the recommended approach is to monitor 100% of the organisation’s cloud environment. Without full coverage, an apparently improving score may reflect missing data rather than reduced exposure.
Executive compliance metrics and KPIs
Executive compliance metrics are measurable indicators of control performance and exposure, chosen for their connection to organisational risk. A focused set might track incident trends and severity, overdue actions, audit completion, staff training and policy review status. These indicators provide useful signals without crowding the main view with operational detail.
For cloud risk, show score trajectories across 30, 60 and 90 days, not just the latest reading. Pair the trend with coverage, open findings and corrective-action closure rates; together, these indicators show whether exposure is changing and whether remediation is progressing. Real-time or near-real-time updates make completed actions visible promptly, while monitoring trends helps executives identify where further attention may be required.
Security reporting for CISOs and boards
Security reporting should give CISOs enough operational detail to manage controls and boards a clear view of material risk. Separate the views, but preserve the evidence trail between them.
Executive and operational reporting
Operational reporting tracks granular execution, while executive reporting summarises results as strategic indicators and risk forecasts. This distinction helps CISOs resolve control-level issues without overwhelming board members with task logs. Teams may need individual audit findings and owners, while directors need the trend, its potential impact and the decision required. A consistent reporting structure connects both views to the same underlying evidence.
Audit trails and compliance reports
An audit trail records how a reported status was established, including its evidence, owner and changes over time. This is important when a board decision or regulatory review depends on the underlying control result. Reports should show evidence status clearly, such as whether a request is open, submitted or approved, and indicate progress on mitigating findings. Linking each measure to its supporting record makes the conclusion traceable.
Automated compliance reporting
Automated reporting draws information from defined systems and applies consistent rules to produce repeatable views. Incident reports, audit logs and HR training databases, for example, can provide inputs for security and compliance measures. Assign owners to source data, set review responsibilities and document how each metric is calculated. Automation can reduce manual consolidation, but it cannot correct incomplete or inconsistently categorised source records.
Accurate, secure and auditable data
Accurate, secure and auditable dashboard data depends on governed sources, controlled access and traceable changes. Establish data ownership and shared definitions before combining records, so teams interpret terms such as “complete” consistently. Apply role-based views: board members need oversight summaries, executives need strategic measures, and compliance teams need detailed records. Keep each reported result linked to its evidence and accountable owner.
To assess dashboard reliability, confirm source coverage, review categorisation and check whether changes remain attributable. A clear record of evidence status helps distinguish verified results from outstanding requests. For UK organisations reporting across regulatory frameworks, this supports meaningful oversight without presenting incomplete evidence as a settled outcome.
Cloud security reporting tools should bring security events, audit records and control evidence into a coherent reporting process. Their value rests on reliable integrations and defined data governance, not simply a consolidated screen. A structured compliance validation approach can help connect reporting with control outcomes and supporting evidence.
What Are Compliance Dashboards?
A compliance dashboard is a centralised view of an organisation’s compliance information, performance indicators and risks. Software offering real-time monitoring and reporting should connect monitoring, reporting, risk management and corrective actions.
Real-time monitoring and alerts
Real-time compliance monitoring updates dashboard information as relevant actions or events are recorded, making changes visible without waiting for a scheduled report. For example, completing a corrective action in a platform can update its dashboard status. This helps executives distinguish open work from completed activity and focus on unresolved items.
Useful alerts turn a change into an actionable signal. A new finding, overdue evidence request or delayed policy review can prompt an owner to assess the issue. Alerts are most useful when they identify the affected control, its status and the next action, rather than generating notifications without operational context.
When choosing compliance dashboard software for real-time monitoring and reporting, look for a platform that connects monitoring, reporting, risk management and corrective actions, while making evidence traceable. It should present relevant information clearly for each role.
Compliance risk monitoring
Compliance risk monitoring tracks changes in exposure, control status and remediation across workflows. It helps leaders identify emerging issues and persistent problems that might otherwise be missed in manual reports. A rise in overdue findings, for instance, may point to a process bottleneck, while declining training completion can signal a workforce compliance concern.
Dashboards should connect risk metrics to evidence and trends, not display scores in isolation. A High, Moderate or Low classification can help prioritise findings, while trend arrows show whether exposure is improving or worsening. For cloud monitoring, coverage matters: monitoring only 60% of deployed workloads leaves the remaining environment outside the dashboard’s view.
A comprehensive cloud risk dashboard should monitor 100% of the organisation’s cloud environment. This makes coverage visible alongside risk scores, helping executives distinguish an actual change in exposure from a change caused by missing asset data.
Data refresh and real-time limits
Dashboard refresh frequency depends on how quickly connected systems supply and process information. Traditional security reports may update weekly, monthly or quarterly, while executive cloud risk dashboards may be described as real-time or near real-time. The practical test is whether changes become visible soon enough to inform the decision at hand.
How often a dashboard refreshes, and what counts as real time, depends on the source system and data flow. A dashboard should show when information was last updated so users can judge whether a status reflects current activity.
Real-time monitoring has limits: incomplete asset coverage, delayed source data or inconsistent workflow records can produce misleading metrics. A dashboard cannot fix those gaps simply by displaying information faster. For example, an apparently low cloud risk score may omit workloads if asset records are incomplete.
These limitations make data quality and workflow ownership essential. Define who records evidence, who reviews findings and how status changes are captured. Clear ownership helps executives interpret trends accurately and prevents incomplete records from appearing as completed compliance activity.
Centralised compliance data and dashboard infrastructure
A centralised dashboard brings compliance information from separate systems into a consistent leadership view. Its infrastructure must preserve data context, ownership and access controls.
Disconnected spreadsheets and manual reports can leave teams working from different versions of the same control record. A centralised data model brings together information from systems such as enterprise resource planning, customer relationship management and security information and event management tools. A control status can then sit alongside its evidence and related finding, instead of being copied between separate files.
Data governance provides the rules that make records interpretable. Define shared categories, assign owners to source data and document how each metric is calculated. If departments classify overdue actions differently, the executive view may misrepresent the organisation’s posture. Consistent definitions let leaders compare performance across teams and frameworks without mistaking a labelling difference for a change in risk.
Interactive visualisation and drill-downs
Interactive visualisation presents compliance information as visual summaries that users can explore for supporting detail. A board member might select a risk indicator to view its trend, affected control and linked evidence. Compliance teams can move from the same summary to findings and remediation records. This layered view keeps the executive screen focused while preserving a practical route to underlying information.
Use charts to show changes over time and tables to display owners, status and evidence. A trend line, for example, can reveal a sustained rise in findings, while a drill-down identifies the affected business area. Use clear labels as well as colour to distinguish categories, so risk remains legible across different views.
Presenting compliance data to executives
Executive presentation condenses detailed compliance records into decision-relevant indicators and context. The top-level view should answer how the organisation is doing in under 10 seconds. Put material exposures, changing trends and decisions required in view; keep control-level documentation available through drill-downs. This gives directors a concise picture without hiding the evidence that supports it.
Role-based views make the same governed information useful to different audiences. Boards receive oversight summaries, executives see strategic measures, and compliance teams access detailed records. Tailoring the presentation to each group’s responsibilities reduces unnecessary detail while maintaining a shared view of the underlying control position.
Data-driven executive decisions
Data-driven decisions connect a measured compliance position to a defined management response. If a department’s overdue actions continue to rise, leaders can examine ownership, process capacity and remediation progress before deciding where oversight or resources should change. The dashboard should show the relevant trend and evidence, not imply that a metric alone explains its cause.
Real-time compliance dashboards for executives can connect compliance indicators with operational context, such as quality, patient safety or financial performance where relevant. A policy delay alongside an operational bottleneck, for example, gives executives a clearer basis for prioritising action. Governance keeps decisions traceable by linking the reported measure, supporting records and management response.
For real-time compliance dashboards for executives, a shared data foundation also supports consistent reporting across frameworks. Leaders can interpret control evidence in context, while teams retain access to the component-level records needed to explain a result.
Executive compliance dashboard design
Real-time compliance dashboards for executives should be designed around decisions leadership must make, not the data systems happen to hold. A useful top-level view should show how the organisation is doing in under 10 seconds.
Dashboard implementation steps
Implementation starts by defining the decisions the dashboard must support, connecting appropriate data and validating how indicators appear. Agree which risks leadership needs to oversee, then assign an owner to each measure and source. Map controls and evidence to those measures before building the executive view. This sequence exposes gaps early rather than presenting incomplete records as a settled compliance position.
Next, establish shared definitions and data governance. Define, for example, when an action counts as overdue and who records its completion. Configure board, executive and compliance-team views around their distinct responsibilities. Test each measure against its evidence, then train users and assign clear ownership for ongoing data quality and dashboard maintenance.
Make implementation roles explicit. Executives set decisions and risk priorities; control owners provide accurate status and evidence; compliance teams map requirements and validate reporting logic; data and technology teams connect and govern source information. This division makes accountability visible and gives leadership a clear route from an indicator to the person responsible for the next action.
Dashboard implementation timeline
A dashboard implementation plan runs from agreeing scope to validating live reporting, with the work shaped by data readiness, integrations and governance. A focused pilot using a defined set of controls can reveal inconsistent definitions before wider deployment. Mapping and reconciling evidence across disconnected spreadsheets and systems also adds work.
Plan the schedule around dependencies rather than an assumed delivery date. Confirm decision priorities first, then assess source ownership, data quality, integration needs, access requirements and testing. Set review points to validate metric calculations and evidence links. A dashboard is ready for executive use when its indicators have accountable owners and users can trace reported statuses to supporting records.
Design the executive screen to prioritise direction, exposure and decisions required. Use clear labels, trend lines and risk categories, with detailed control records available through drill-down views. For real-time compliance dashboards for executives, the leadership summary should reflect the organisation’s posture, while operational users need enough detail to manage actions. This keeps the board-level view from becoming a crowded task register.
Keep board reporting concise and decision-led. An 8 to 12-slide presentation can organise the compliance position around trends, significant findings, remediation progress and decisions requested. Connect each chart to a defined period and evidence source, so a change in status has context. Where relevant, relate compliance indicators to quality, patient safety and financial performance, rather than presenting risk in isolation.
Review the design through real decisions: can a director identify the issue, its direction and the required response? Can a control owner trace the result to evidence? Use feedback to refine labels and access. Explore a dashboard implementation approach to structure compliance measures around accountable controls and evidence.
CWORT
CWORT turns regulatory obligations into structured compliance activities and links evidence to control outcomes for auditable proof. It is relevant when executive reporting needs a traceable connection between requirements, assigned work, findings and remediation, rather than another disconnected spreadsheet.
The platform supports DORA Compliance Readiness and Assessment, UK NIS Compliance Management, NIS2 Readiness and Compliance Management, and ISO 27001 Readiness and Control Mapping. These offerings help organisations structure readiness and compliance work around applicable frameworks, with clearer visibility of activity and evidence for leadership.
Consider this approach when fragmented tracking makes it difficult to establish control status or demonstrate how evidence supports an outcome. Contact CWORT to discuss your compliance reporting needs.
Turn executive visibility into accountable action
A dashboard earns its place in governance when leaders use its evidence to assign ownership, direct remediation and revisit unresolved risks. Treat each executive review as a decision point: record the agreed action, accountable owner and evidence that will demonstrate progress. This keeps reporting connected to operational change rather than leaving indicators as passive measures.
Real-time compliance dashboards for executives are most useful when the information they present supports that continuing cycle of oversight. CWORT offers DORA Compliance Readiness and Assessment, UK NIS Compliance Management, and NIS2 Readiness and Compliance Management to help organisations structure their compliance work and evidence.
Make the next step a clear discussion about your reporting priorities, framework requirements and evidence needs. Contact CWORT to discuss your dashboard needs, and move towards reporting that supports confident, accountable decisions.
Frequently Asked Questions
What features should an executive real-time compliance dashboard include?
An executive dashboard should connect framework-mapped control status with evidence, accountable judgement and recorded approval. CWORT’s workflow moves through Configure, Collect, Analyse and Prove, preserving the criteria and evidence behind conclusions. AI tools can support analysis or drafting, while CWORT governs the output and keeps AI suggestions distinct from the auditable decision record. Prioritise features that let leaders trace a conclusion to its owner and supporting material.
How do compliance dashboards integrate with existing business systems and data sources?
Integration connects a governed compliance layer to operational tools and maps incoming records to controls and framework requirements. CWORT can aggregate evidence from SIEM, EDR/XDR, vulnerability-management platforms, asset registers, IAM/PAM and OT/ICS monitoring. Existing security tools serve as evidence sources rather than being replaced by the dashboard. Defined mappings and ownership help preserve context as records feed executive reporting.
What UK regulations and standards should compliance dashboards support, including UK GDPR and FCA rules?
Select frameworks according to the organisation’s obligations and operating context. UK GDPR and the Data Protection Act 2018 may be relevant to personal-data governance; financial services organisations should map applicable FCA rules alongside other requirements. Cyber and assurance frameworks may include UK NIS, NIS2, DORA, ISO 27001 and NCSC CAF, where applicable. A dashboard can help organise selected obligations against controls and evidence, while teams assess their relevance to the organisation.
Which compliance dashboard software offers real-time monitoring and reporting?
Look for software that connects monitoring, reporting, risk management and corrective actions, with real-time updates and traceable evidence. It should present relevant information clearly for each role.
How do leading compliance dashboard platforms compare on features, security and pricing?
Compare data coverage, update frequency, evidence traceability, access controls and reporting detail. Check for role-appropriate access and clear records of changes, and compare pricing by included features and service scope.
How much do compliance dashboard tools cost in the UK?
In the UK, costs are provided after a quote request. They depend on factors such as user numbers, integrations, data coverage and required features.
Disclaimer
The content on this site is provided for general information and educational purposes only. It does not constitute legal, regulatory, financial, or professional advice. CWORT provides AI-assisted insights and workflow automation, but all compliance decisions remain the responsibility of your organisation and its management. Always seek qualified legal or regulatory guidance for decisions relating to the UK NIS Regulations, CAF, DORA, NIS2, ISO 27001, or other obligations.
Related posts
How to Demonstrate Control Effectiveness to Regulators: A Strategic Guide
Learn how to demonstrate control effectiveness to regulators with our guide. Shift from chaos to an evidence-based, audit-ready compliance programme today.
Auditable Compliance Proof Software: A Strategic Guide to Regulatory Validation in 2026
Stop documenting history and start managing risk. Our guide to defensible compliance evidence software prepares your organisation for tough 2026 regulatory a...
Streamlining Regulatory Compliance Processes: From Manual Tracking to Orchestrated Validation
Stop wasting money on manual compliance. Learn about streamlining regulatory compliance processes to reduce personal liability under DORA & NIS2 and gain aud...
Article by
Michael Iyiola
Co-Founder, CWORT
Michael Iyiola is a co-founder of CWORT and a Cyber and AI Security Engineer with deep experience in vulnerability management, detection engineering and operational resilience across UK critical national infrastructure, including rail, energy and financial services. At CWORT, he designs scalable, evidence-driven workflows that help teams meet modern regulatory and security demands.
Build Your Foundation of Auditable Certainty
Take control of your regulatory obligations and secure your infrastructure with CWORT.